Table of Contents
TL;DR
Here’s the JavaScript function to convert a three-dimensional point into a two-dimensional one:
function to_isometric(point) {
  const angle = Math.PI / 6; // 30°
  const cos = Math.cos(angle); // ≈ 0.866
  const sin = Math.sin(angle); // = 0.5

  return {
    x: (point.x - point.y) * cos,
    y: (point.x + point.y) * sin - point.z
  };
}
If you can’t convert this into the programming language you’re using, you don’t deserve to have an isometric design in your game.
More detailed explanation
Isometric graphics were and still are common in games. This style offers a kind of blend between 2D and 3D that creates a unique look.
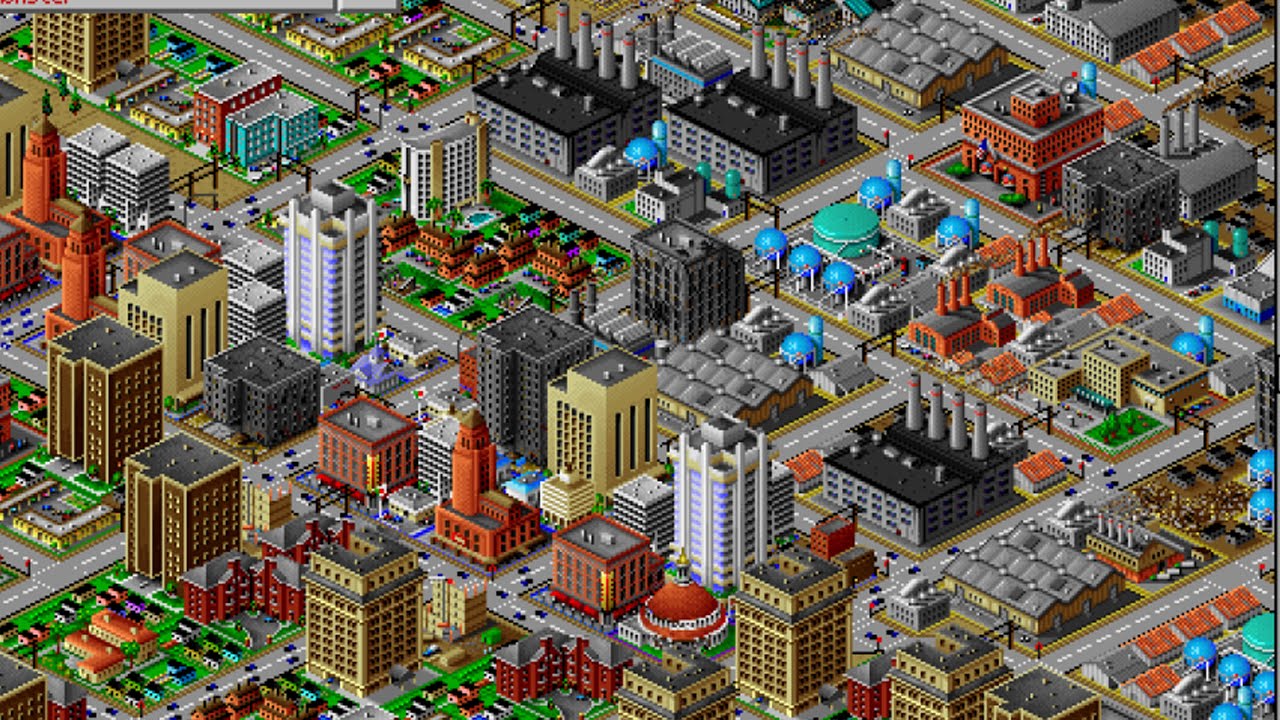
The game SimCity is an example of one that uses the isometric art style.
Isometric drawing works through three lines separated by 60º from each other, where each represents a dimension. These lines allow you to convert a three-dimensional point into a two-dimensional one using orthographic projection:
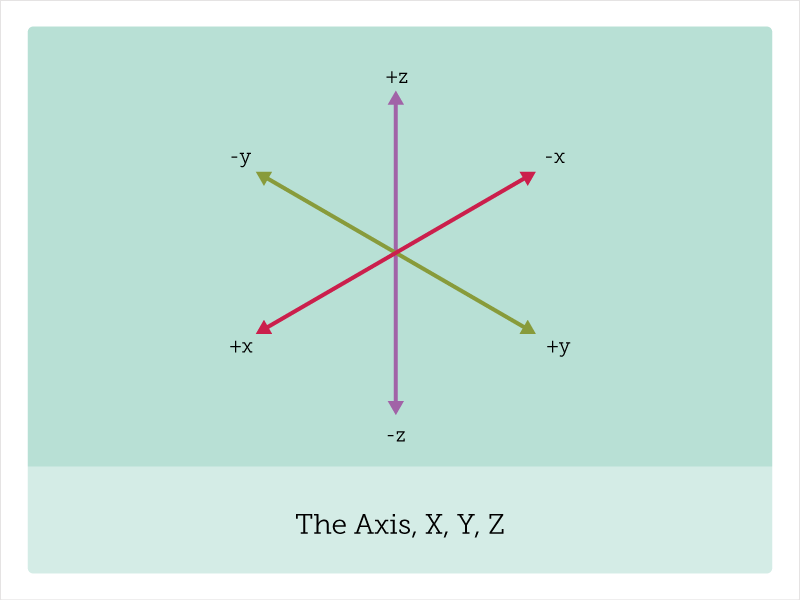
The math behind it

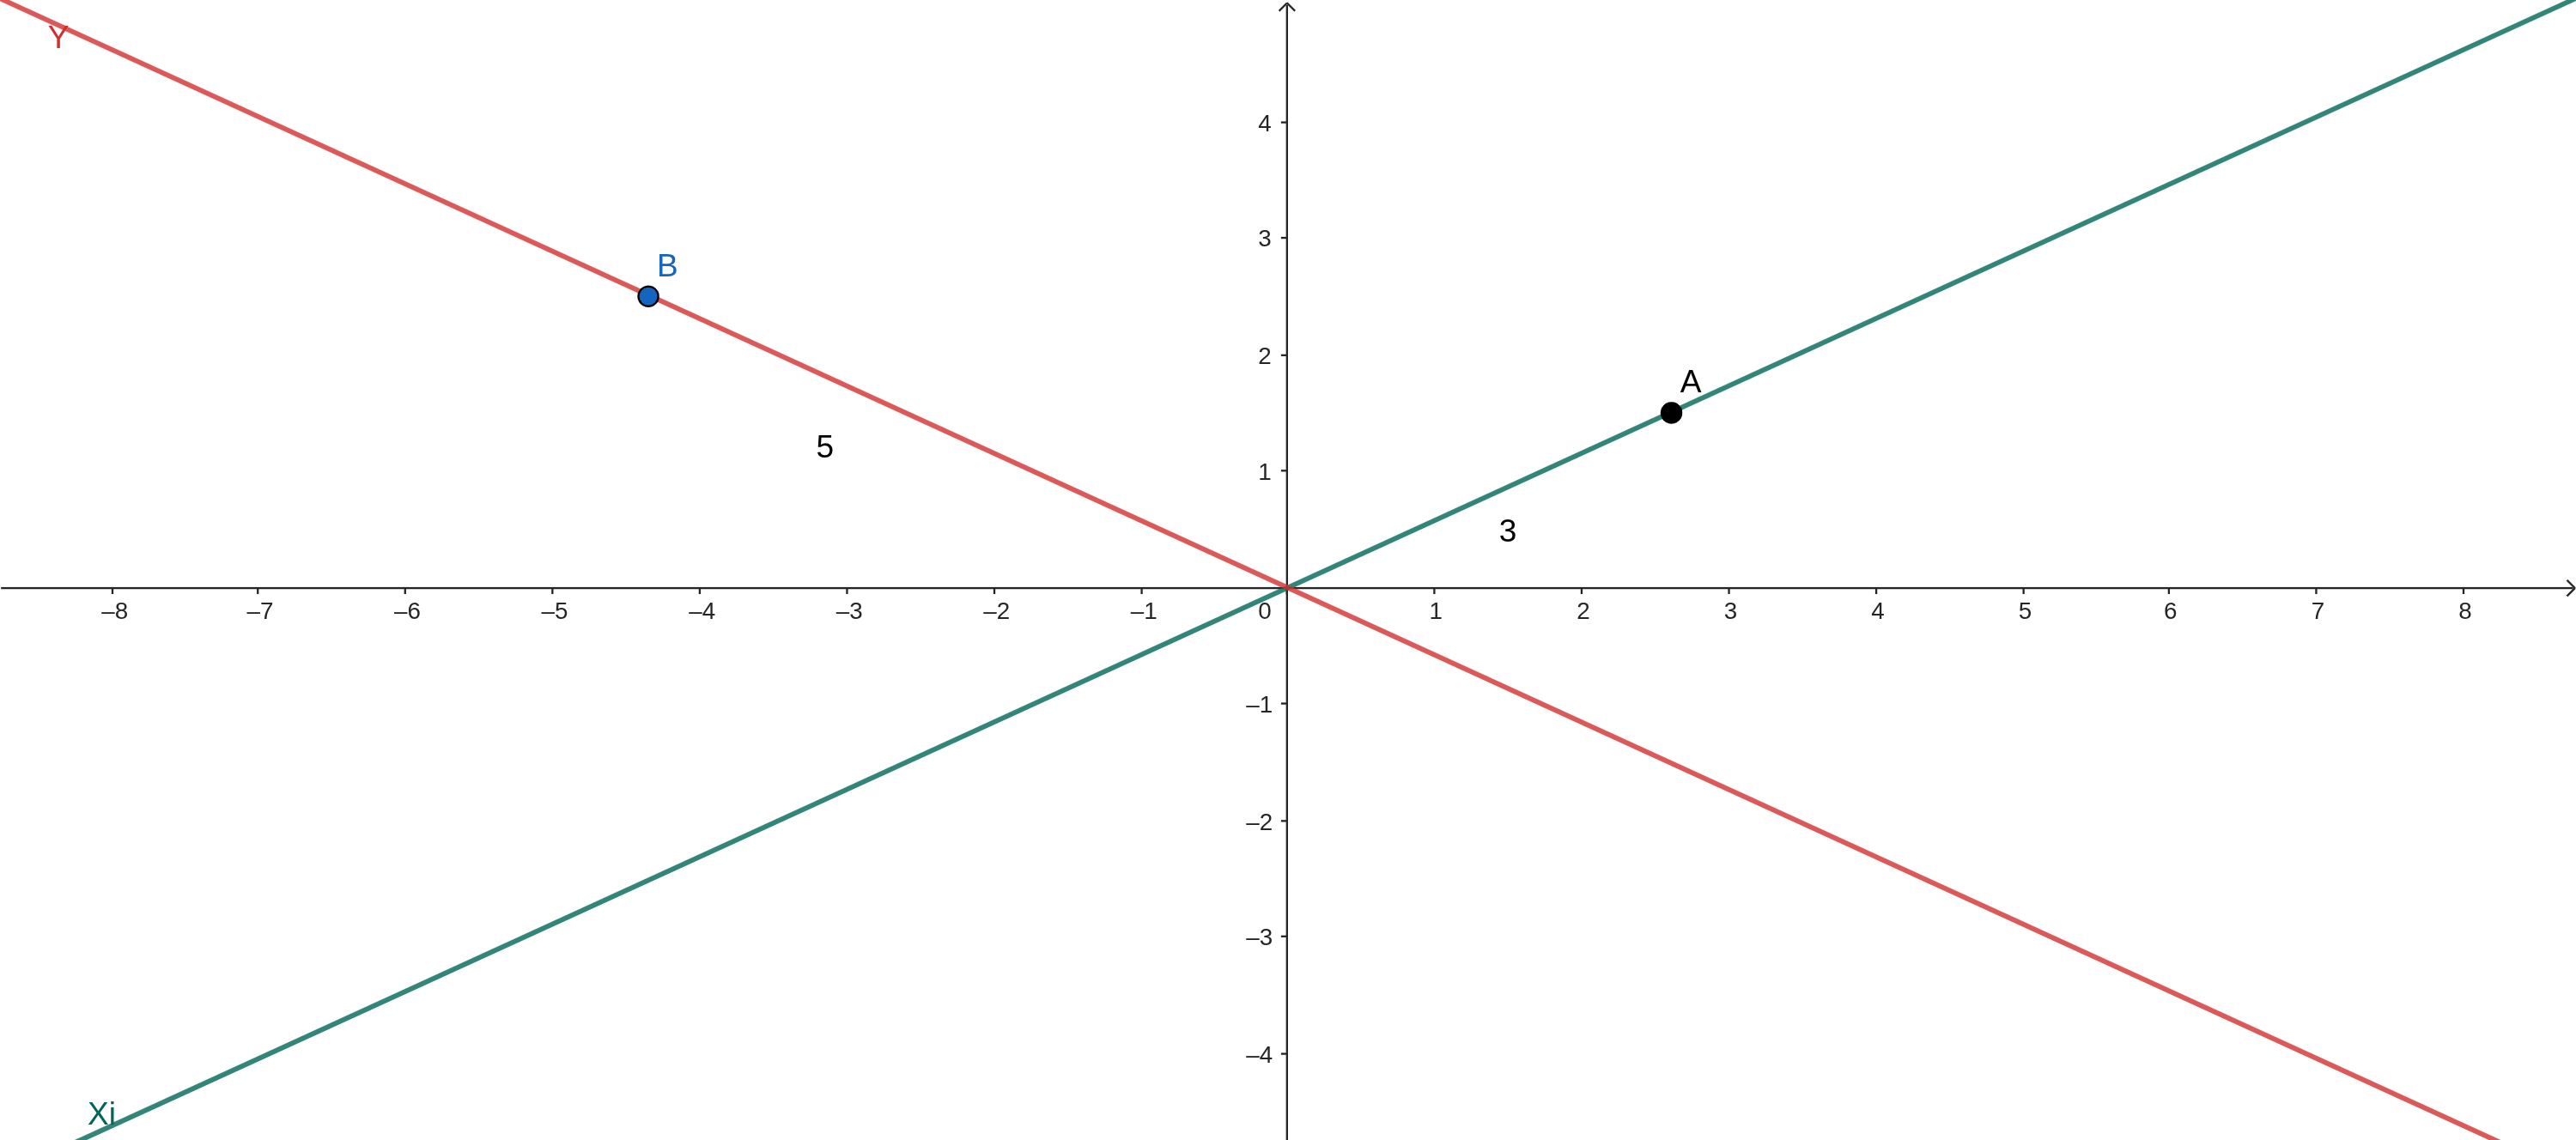
In isometric drawing, as mentioned, we have three lines separated by 60º from each other. However, since the Z axis is completely vertical, let’s focus, for now, only on X and Y:
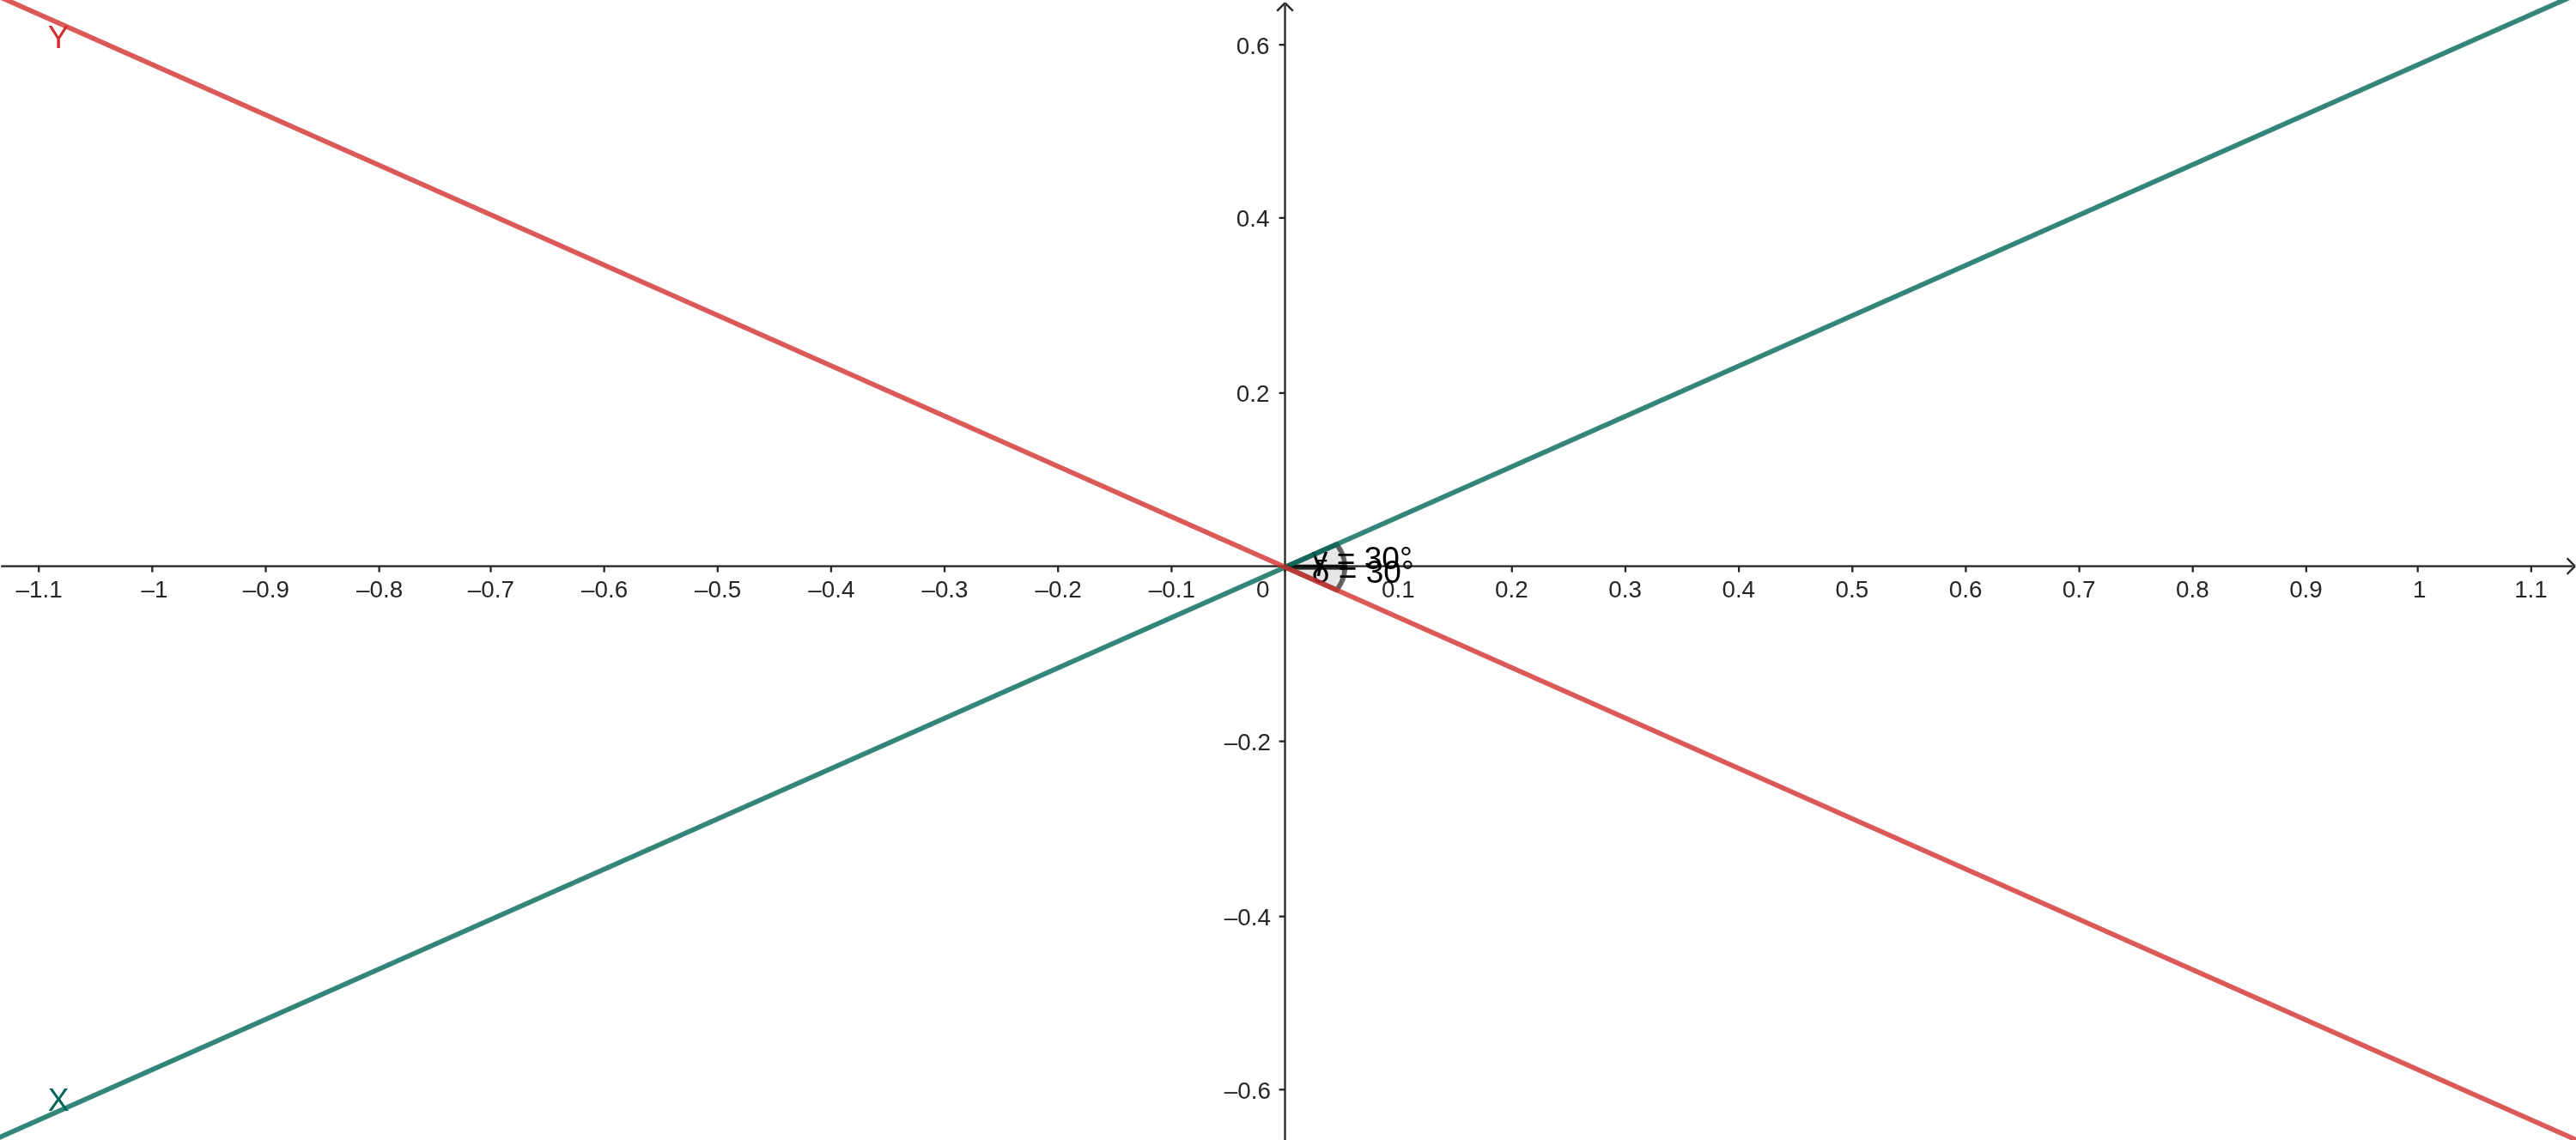
As you can see, the X and Y axes are at an angle of 30º relative to the real X axis (in the previous case they were at angles of 60º from each other). So the first thing to do is to find the points on each line according to the distance from the origin — which can be done with sine and cosine. For this, let’s suppose a three-dimensional point T = (3, 5, 0) (the Z dimension won’t be considered for now), and we want to find a two-dimensional point A (on the X line) and B (on the Y line):
Calculating A and B:
Plotting the points on the graph:
Now, to find the real point R — the one that will be drawn on the screen — we need to add the two vectors:
Plotting it on the graph:
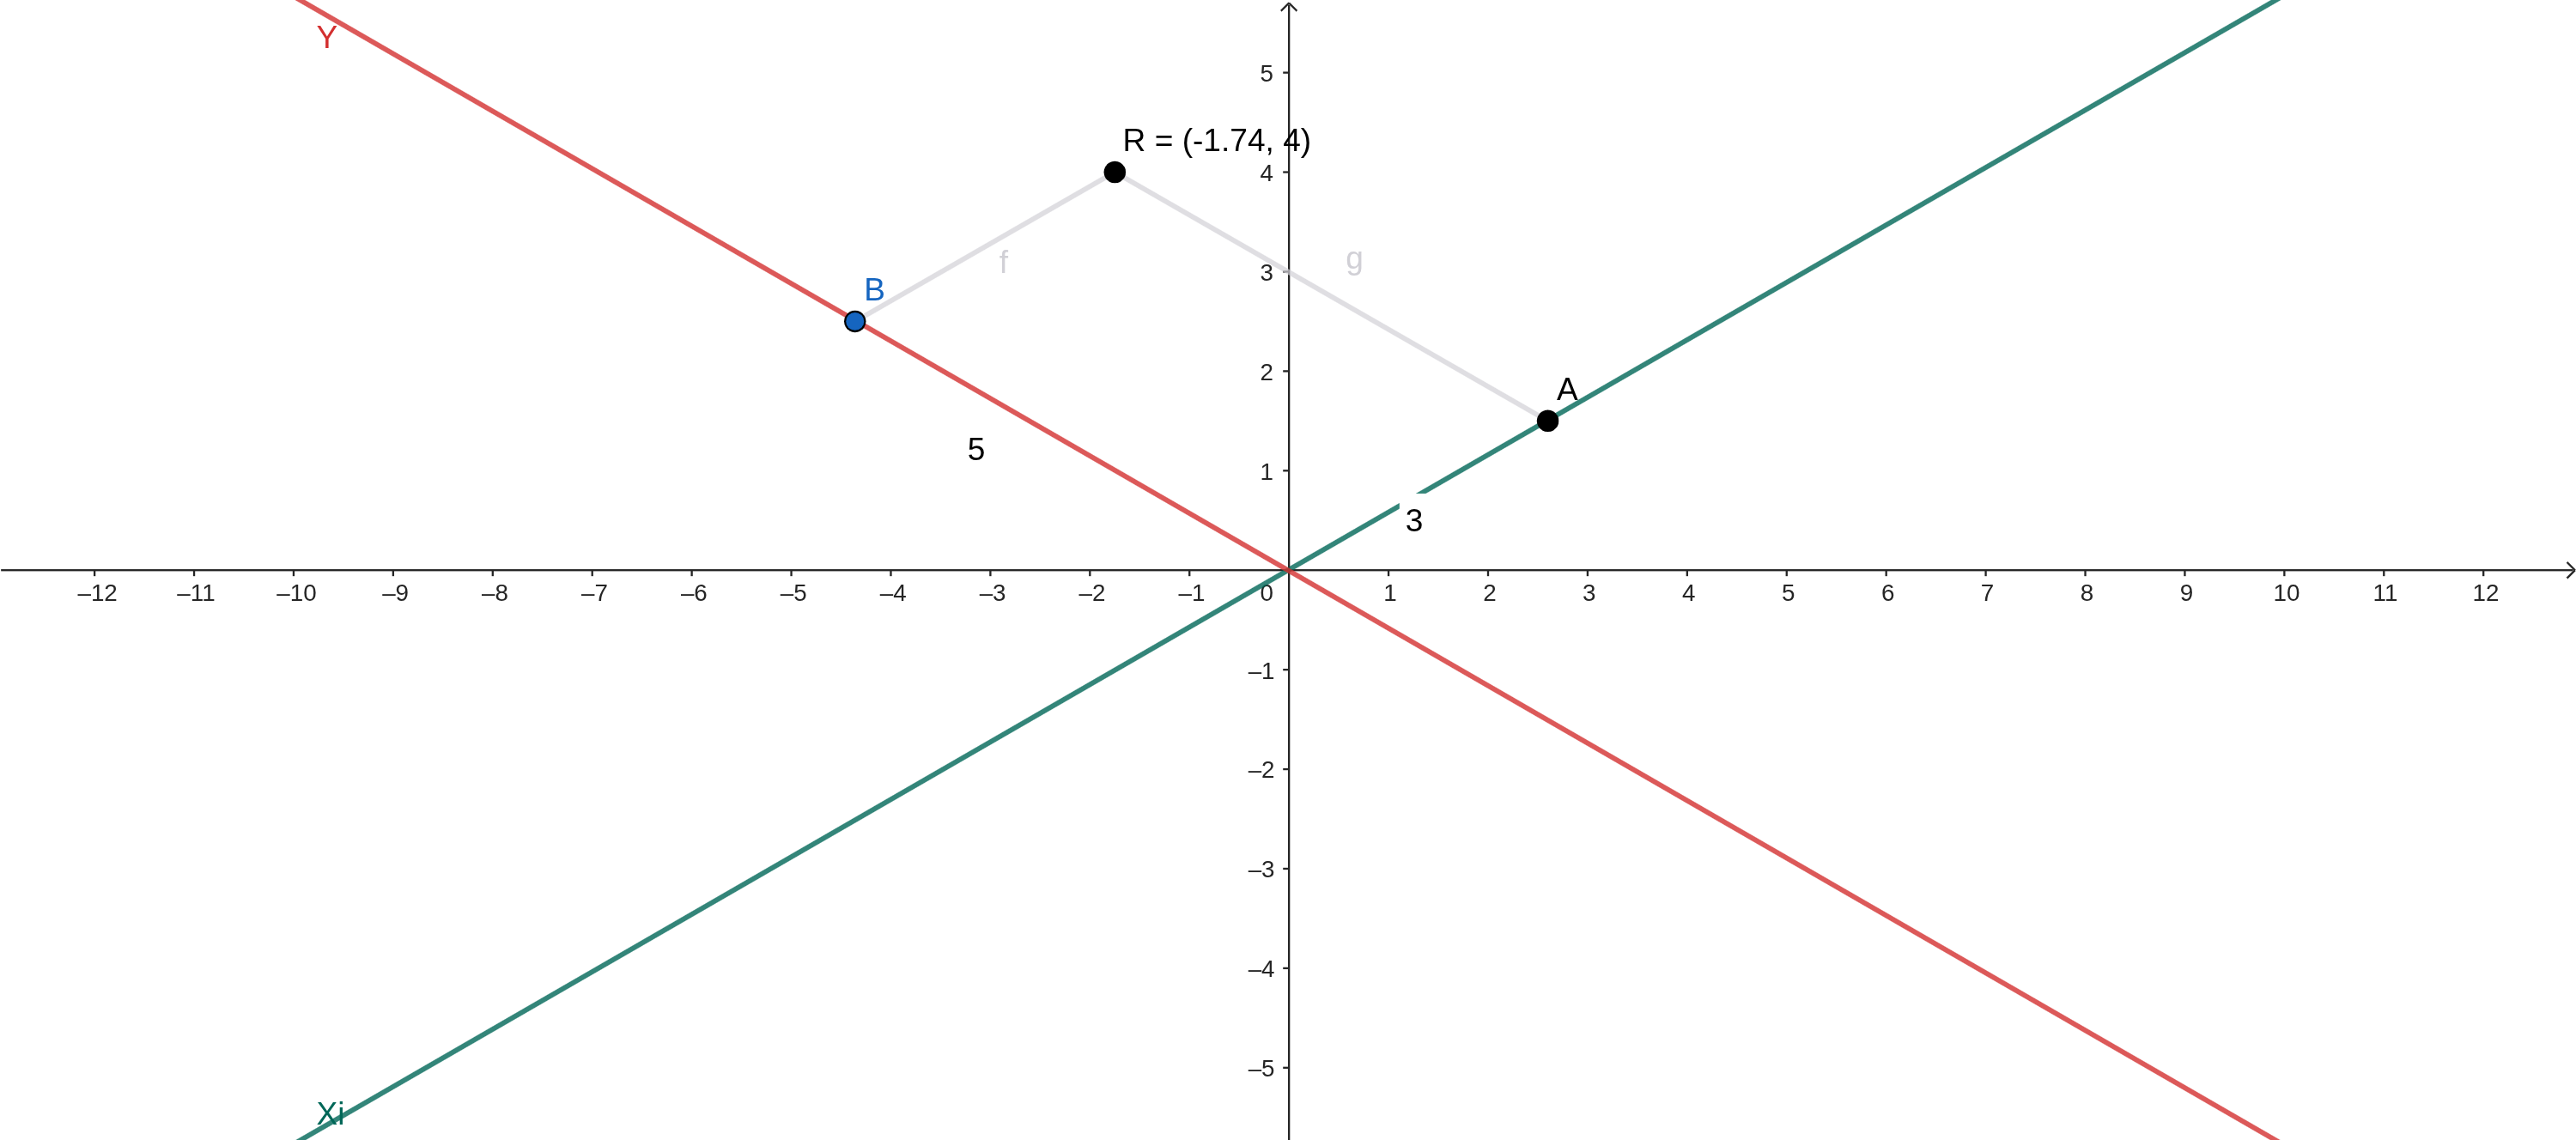
To add the Z axis, just add this value to the real Y value plotted — since the Z axis is completely vertical —, so if the Z value of point T were 3, the position vector to be drawn would be $\begin{pmatrix} -1.74 \ 7 \end{pmatrix}$.
Generic function
A generic function would look like this:
Why is Z subtracted in the JavaScript function instead of added?
If you’re very observant, you may have noticed this. The reason is that in most graphics libraries (SDL, HTML Canvas, Raylib, p5.js, etc.), the smaller the Y value, the higher the point appears — which is the opposite of most Cartesian planes, like GeoGebra’s, which I used to demonstrate how it works. However, if you’re using a game engine like Unity or Godot, you should change it to add instead of subtract.
Implementing in p5.js
By opening editor.p5js.org, there’s an online editor where you can program in JavaScript using the p5.js graphics library — it’s not one of the best for creating games, but it’s very easy and widely used for learning programming.
Initially, a code like this will appear:
function setup() {
  createCanvas(400, 400);
}

function draw() {
  background(220);
}
The setup function runs only once, at the start of the game, while draw runs every loop. Running it, we only see this:

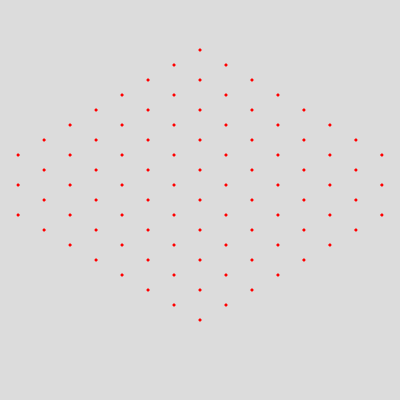
What we want to do is create a grid that moves like waves, and for that, we’ll use the function from the TL;DR. Then, we’ll draw equally spaced points using that function:
[...]
function draw() {
  background(220);

  // Put the camera in the center
  translate(width/2, height/2)

  const grid_size=5
  const grid_distance=30
  for (let y=-grid_size; y<grid_size; y++) {
    for (let x=-grid_size; x<grid_size; x++) {
      // Transform 3D point into 2D
      let drawn_point = to_isometric(
        {x: x*grid_distance, y: y*grid_distance, z: 0}
      )

      // Draw the point
      stroke(255, 0, 0)
      strokeWeight(3)
      point(drawn_point.x, drawn_point.y)
    }
  }
}
Thus, the result is this:
Animating the points
For this, we’ll use the sine function, which, on a graph, looks like this:
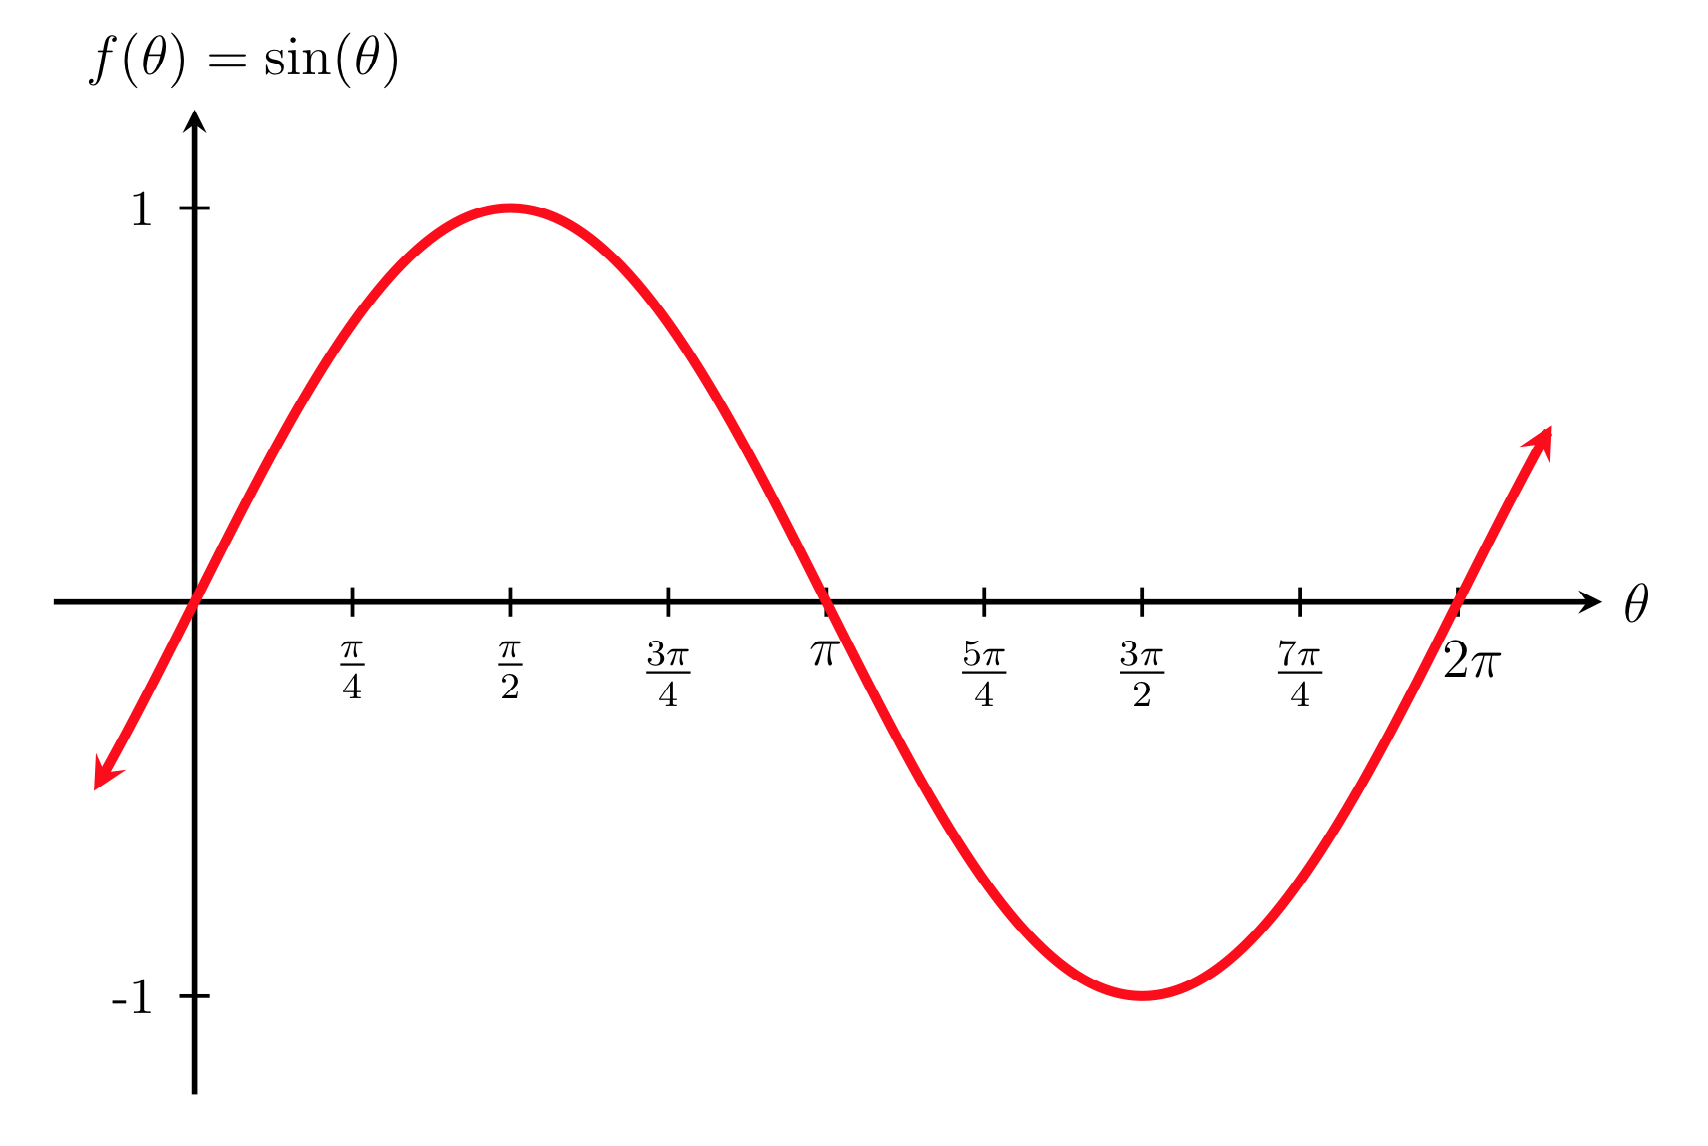
Passing the time since the start of the program into the function, which can be done with p5.js’s millis() function — it returns how many milliseconds since the start of execution — we can animate them:
let drawn_point = to_isometric(
  {x: x*grid_distance, y: y*grid_distance, z: Math.sin(millis()/1000)*20}
)
Result:
However, as we can see, all the points move equally. To change this, let’s add an offset value for each point, defined by their Y position:
let drawn_point = to_isometric(
  {x: x*grid_distance, y: y*grid_distance, z: Math.sin(millis()/1000+y)*20}
)
Result:
Adding sprites
For this, I’ll use these sprites from opengameart.org. Then, I cropped and reduced the resolution in GIMP so it’s just a cube:

Download this image and place it in the editor. To do this, create an account and then click the arrow on the left side of the editor, then click the “plus” symbol and “Upload file,” and select the cube file.
To draw the cube, define a global variable called cube:
let cubeThen, inside the setup() function, assign the variable as the cube texture:
cube = loadImage('cube.png')And instead of drawing the point, draw the texture, remembering to keep its size as grid_distance times two:
/*stroke(255, 0, 0)
strokeWeight(3)
point(drawn_point.x, drawn_point.y)*/
image(cube, drawn_point.x, drawn_point.y, grid_distance*2, grid_distance*2)
Result: